sunken treasure
Categories: other
2020-07-24
by not_really
We think Blathers might be looking for treasure in the Pacific Ocean not too far from an island. The only data we were able to find about his travel were these logs we pulled from his Uber app. Maybe you can make some sense of them?
Note: the flag format is slightly different in this challenge.
Files: log.gz
Since the hint we were given was Uber, I expected that we would plot coordinates on an image and get the flag. I didn’t recognize the format though. It just looked like random strings of hex.
8a5d15d06897fff
8a5d15d068b7fff
8a5d15d0699ffff
8a5d15d06987fff
8a5d15d069b7fff
8a5d15d3165ffff
8a5d15d31647fff
8a5d15d31667fff
8a5d15d3174ffff
8a5d15d3176ffff
8a5d15d31397fff
8a5d15d313b7fff
8a5d15d310effff
8a5d15d31057fff
8a5d15d31077fff
8a5d15d3115ffff
8a5d15d3115ffff
I was about to manually try decoding this when it was brought up that Uber has a repo called h3. And one of the tools is called h3ToGeo. We have to build it ourselves, but we get a nice executable that we can call on to get coordinates. I would’ve preferred an api, but I couldn’t get the bindings to work.
We can use h3ToGeo --index [line here] to get lat and lon. From there, it’s a pretty straightforward problem.
import matplotlib.pyplot as plt
import os

def decode(index):
    text = os.popen("h3ToGeo --index " + index).read()[:-1]
    textSplit = text.split(' ')
    lat = float(textSplit[0])
    lon = float(textSplit[1])
    return (lon, lat)

logFile = open("log", "r").read().splitlines()
positions = []
for line in logFile:
    positions.append(decode(line))

# make the points all fit nicely into a box we get
# the bounds of the points and set the image size
# to the difference of the max and min
minX = min(positions, key = lambda t: t[0])[0]
minY = min(positions, key = lambda t: t[1])[1]
maxX = max(positions, key = lambda t: t[0])[0]
maxY = max(positions, key = lambda t: t[1])[1]
xSize = maxX - minX;
ySize = maxY - minY;
# this is just to keep the same ratio so it doesn't
# turn into an unreadable square
bestRatioSize = min(xSize, ySize)

targetSize = 1000

plt.axes()
for pos in positions:
    cropX = (pos[0] - minX) * targetSize / bestRatioSize
    cropY = (pos[1] - minY) * targetSize / bestRatioSize
    rect = plt.Rectangle((cropX, cropY), 5, 5, fc="red")
    plt.gca().add_patch(rect)

plt.axis("scaled")
plt.show()
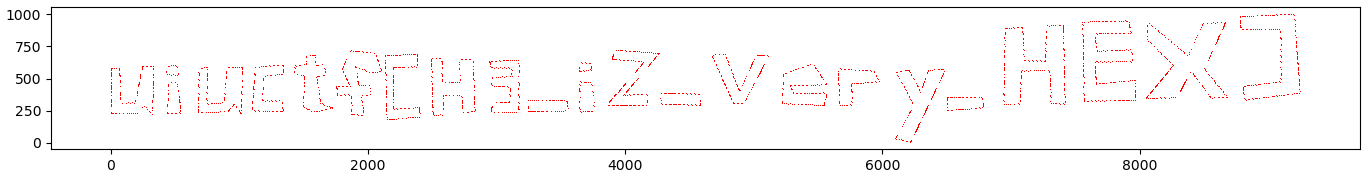
It’ll take a little while for all the h3ToGeos to execute, but eventually you should get something like this: